
For many people, selecting an ice cream flavor — even when there are many to choose from — is an easy decision. Either they have a clear preference for a certain flavor or they enjoy trying something new. Others have difficulty choosing. This is not a very risky choice; the worst-case scenario is that they don’t like the flavor. In contrast, the stakes are much higher when selecting a health plan or drug plan. The selection process can be much more stressful and the outcome riskier.
Choosing a Medicare Part D plan
Medicare beneficiaries can compare Part D plans online. Plan listings include their star rating, monthly premium, deductible, and a yearly drug-plus-premium cost tool (which estimates the cost to fill prescriptions at selected pharmacies plus premiums for the months left in this year). When using this tool, a user can specify a drug’s dosage, quantity, and frequency of fill. Plans can then be sorted by lowest yearly drug deductible, lowest drug-plus-premium cost, or lowest monthly premium. (Already, this is far more complicated than picking “vanilla” or “chocolate.”) In addition, up to three plans can be selected for a side-by-side comparison.
However, the online tool does not help consumers calculate their minimum annual out-of-pocket (OOP) cost, nor does it sort plans this way. The estimated total drug-plus-premium cost can be confusing, and it does not even include the deductible.
Choosing a marketplace plan
In the federal Health Insurance Marketplace (healthcare.gov) and state-run exchanges, plan categories (bronze, silver, gold, and platinum) are based on how the plan and consumers share costs. Healthcare.gov listings include a plan’s star rating, monthly premium, deductible, and maximum OOP cost. Consumers can learn about OOP costs for primary and specialist care visits, emergency and hospital care, and prescription drugs. They also can learn whether a provider is in a plan’s network and which plans cover a particular drug. Plans can be sorted by premium or deductible and filtered by specified ranges for the same. And up to three plans can be selected for a side-by-side comparison.
While healthcare.gov does not help consumers calculate their minimum annual OOP cost, it reminds consumers that “it’s important to think about all costs for the year,” which it describes as premium payments (less any qualifying tax credit) plus the deductible and any copay or coinsurance charges. Healthcare.gov provides a tool to help users estimate total yearly costs based on expected household utilization at three levels (low, medium, or high).
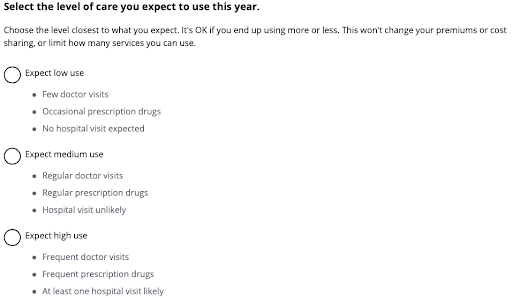
However well intended, this approach has a few shortcomings. First, some people won’t bother to use the tool to estimate total yearly costs. Second, some of those who attempt to estimate their total yearly costs may not click all the links to read all the “helpful” text. Third, some of those who read that text may not understand it. Fourth, some of those who understand the text may still have difficulty predicting their healthcare use or aligning their expected use with the descriptors provided for each use level. Fifth, the appropriate but somewhat buried reminder that “nobody can predict what care they’ll need” may be anxiety-inducing.
Difficult decisions
There are several reasons why consumers struggle with plan-selection decisions:
- High stakes: Consumers may spend more for coverage they may not need or spend less for coverage that may be inadequate and financially toxic.
- Many options: In some markets, the number of plans available to a consumer can be two or more times the 31 flavors served at Baskin-Robbins.
- Difficulty predicting needed care.
- Difficulty simultaneously controlling for the deductible, premium and co-payments or coinsurance. When describing consumers’ inability to calculate their OOP costs, Columbia University psychologist Eric Johnson says “They just can’t do the math.”
- Difficulty controlling for any applicable tax implications.
- Inadequate decision-support tools. These tools typically do not calculate the OOP minimum cost or give consumers the ability to sort or filter choices this way.
We haven’t even scratched the surface when it comes to employer-sponsored health coverage. For large companies — particularly multistate jumbos or unions that offer a menu of plans — how are choices and comparisons communicated to workers? Types of plans, centers of excellence, even a medical tourism benefit — how do employees know what’s in their best interest?
Often, they don’t. One study showed how the majority of employees at a large U.S. firm — especially older workers, women, and low earners — chose more costly options, resulting in substantial excess spending. The researchers concluded that these seemingly irrational choices reflected very low health-insurance literacy and naïve considerations about health risk and price, rather than a sensible comparison of plan value. However, the researchers could not rule out an alternative explanation: that some employees prefer to finance health spending through payroll deductions rather than through OOP expenses, and are willing to pay a premium to do so.
Some consumers find comfort in sticking with what they know and simply re-enroll in their same plan. This inertia may be due to inattention to plan choice and/or switching costs. Some consumers simplify the search by focusing on a single variable (e.g., the monthly premium) or are attracted to options displayed toward the top of the list. And a small minority do the math and select a plan that, in their eyes, optimizes value.
The plan-selection process can cause stress and anxiety; for many, selecting a plan is a source of considerable confusion and distress. Has anyone quantified the mental health utilization and costs related to this process? Consumers who find complex decisions challenging or those with a lot on the line (sicker and/or poorer) may be more vulnerable to negative outcomes. Groups less familiar with or having less access to online tools may also be at greater risk.
Helping consumers solve the puzzle
There is some evidence that the use of decision-support tools can increase consumer satisfaction with the plan selection process. Decision-support tools should, at a minimum, help consumers calculate the minimum out-of-pocket cost for each plan. These tools should also help consumers predict the amount of care they will likely need. Perhaps this can be achieved through a series of validated prompts — honed questions related to health behavior, health status and utilization trends may be helpful. And to be most effective, decision-support tools should be linguistically and culturally appropriate.
People could be assigned to a default option that is most cost efficient and given an option to opt out. Doing so could help some consumers save money. And if benefits vary among a large set of options, then the most cost-efficient plan for each plan design could be clearly identified.
Adding plans may increase a group’s satisfaction, but eventually there are diminishing returns and ultimately a point at which more options results in lower satisfaction. So, managing the number of plans is also important.
The consequences of ice cream flavor decisions are fleeting, but the ramifications of plan selection decisions can reverberate for up to one year. Choice architecture and communications experts can help increase consumer satisfaction with both the plan selection process and outcome.